The economic resilience of a Toronto neighborhood is a direct function of its ‘cultural infrastructure’, a factor far more predictive of long-term value than generic metrics like transit alone.
- Stable investment potential is revealed by analyzing hyper-local economic indicators like the density of independent ethnic businesses and festival-driven rental demand.
- Identifying emerging cultural enclaves before property values spike requires tracking demographic momentum and the evolution from first to second-generation businesses.
Recommendation: Shift your investment analysis from conventional indicators to quantifying a neighborhood’s cultural vitality as the primary measure of its recession-proof stability.
For any real estate investor eyeing the Toronto market, the landscape is a paradox of high potential and unnerving volatility. Conventional wisdom dictates a familiar checklist for identifying a sound investment: proximity to a TTC station, access to the GO line, or a location within a top-ranked school district. While these factors certainly hold weight, they represent an incomplete and increasingly crowded strategy. In a market as dynamic and complex as Toronto’s, relying on these platitudes alone is like navigating the city with a map from 1980; you’ll see the main roads, but miss the vibrant, resilient arteries that truly define its economic lifeblood.
This oversight leaves investors vulnerable to market fluctuations and misses the most potent, yet often unquantified, asset Toronto possesses: its profound multicultural fabric. The real story of neighborhood stability isn’t just about transit scores or school rankings. It’s written in the storefronts of independent ethnic grocers, in the packed restaurants of a burgeoning culinary scene, and in the annual rhythm of cultural festivals that transform local economies. These are not merely ‘lifestyle features’; they are the components of a robust cultural infrastructure that underpins economic resilience.
But what if the key to a recession-proof investment wasn’t just finding a ‘diverse’ neighborhood, but learning to read its economic DNA? This analysis moves beyond the surface-level appreciation of multiculturalism to provide a concrete framework for investors. We will dissect how to measure a neighborhood’s vitality, identify the next cultural hotspot before it booms, and understand the subtle economic shifts that signal long-term, stable growth. This is about trading generic advice for a sophisticated, demographic-driven investment strategy tailored for the reality of modern Toronto.
To navigate this analysis, we will explore the tangible economic impact of cultural phenomena, from large-scale festivals to the micro-economy of a single commercial street. This guide provides a structured approach to identifying the true drivers of property value and resilience in Toronto’s most dynamic communities.
Summary: How to Analyze Toronto’s Neighborhoods for Recession-Proof Investing
- How Local Festivals Like Caribana Impact Short-Term Rental Demand in August?
- How to Spot the Next “Greektown” Before Property Prices Spike by 20%?
- Little Italy or Little Portugal: Which Offers Better Walkability for Young Families?
- The Respectful Visitor’s Error That Offends Locals in Traditional Neighborhoods
- How to Assess a Neighborhood’s Vitality by Counting Independent Ethnic Grocers?
- Good Schools vs Transit Access: Which Drives Property Value Higher in the Suburbs?
- Why the Best Dim Sum Is Found in Markham and Not Downtown Chinatown?
- Choosing a Strategic Neighborhood: How to Spot Gentrification Before Prices Spike?
How Local Festivals Like Caribana Impact Short-Term Rental Demand in August?
A neighborhood’s economic resilience is often tested during periods of discretionary spending. Yet, in Toronto, cultural festivals create predictable, recession-resistant economic spikes that savvy investors can leverage. The Toronto Caribbean Carnival (Caribana) is a prime example. Every August, it doesn’t just bring music and parades to the streets; it injects a massive, concentrated demand for short-term accommodation into specific areas like Little Jamaica and the downtown core. This isn’t an anomaly; it’s a feature of cultural infrastructure. For instance, a similar effect is seen with other large events, where The Taste of the Danforth festival drew an estimated 1.5 million visitors in past years, creating a surge in local spending and rental demand.
For an investor, this translates into a tangible opportunity. A property in a neighborhood that hosts or is adjacent to a major annual festival benefits from a recurring, high-demand period that can significantly boost rental yields and buffer against off-season vacancies. This demand is often inelastic; attendees are drawn by the cultural event itself, making them less sensitive to broader economic downturns. The key is to look beyond the festival’s single-weekend impact and recognize it as a recurring revenue stream and a powerful indicator of a neighborhood’s sustained cultural relevance and economic vitality. This predictable demand cycle provides a layer of financial stability that properties in culturally inert neighborhoods lack.
Analyzing this impact requires a granular approach. It involves tracking year-over-year short-term rental pricing and occupancy rates during festival periods, contrasting them with non-festival months. An investor can observe how furnished units in proximity to parade routes or event venues outperform the broader market. This isn’t just about tourism; it’s about a specific form of cultural tourism that anchors a neighborhood’s value proposition. By identifying these patterns, you can pinpoint properties that benefit from a reliable, culturally-driven economic engine, making them inherently more resilient investments.
How to Spot the Next “Greektown” Before Property Prices Spike by 20%?
Identifying the next high-growth neighborhood is the holy grail of real estate investment. While many chase generic “up-and-coming” areas, the most predictable transformations in Toronto are driven by demographic momentum. The evolution of Greektown on the Danforth serves as a perfect historical blueprint. What began as a settlement for Greek immigrants in the 1960s evolved into a vibrant, economically powerful district. This wasn’t an accident; it was the result of building a complete cultural infrastructure—restaurants, bakeries, community centers, and businesses—that served a specific community and eventually attracted the entire city.
This transformation is a multi-stage process. Initially, an immigrant group establishes a foothold in an affordable area. As the community grows, it creates a self-sustaining micro-economic ecosystem. Eventually, this cultural concentration becomes an attraction in itself, leading to what can be termed “cultural evolution” or gentrification, which in turn drives property values upward. The key for an investor is to identify neighborhoods in the early stages of this process, long before the mainstream market takes notice.
Case Study: Greektown’s Evolution from Enclave to Premium Neighborhood
Greektown on the Danforth illustrates this pattern perfectly. It transformed from a 1960s immigrant settlement into a district boasting one of the highest concentrations of restaurants per kilometer in the world. Even as the area gentrified, the cultural core remained; by 2016, Greeks still constituted a significant 4.5% of the local population. This persistent cultural presence acted as an economic anchor, ensuring stability and continuous appeal even as property values surged with the addition of public squares and higher-priced establishments.
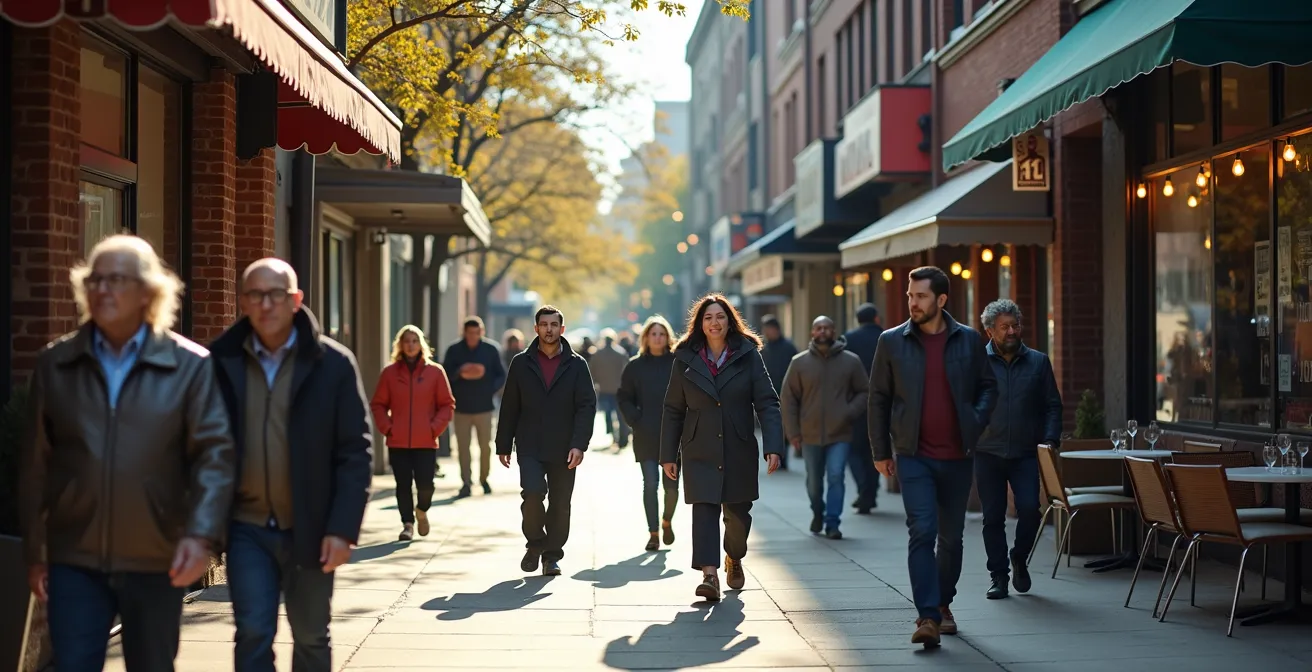
This street-level view shows the tangible results of this evolution, where legacy storefronts coexist with modern cafes, creating a dynamic streetscape that attracts a diverse mix of residents and visitors.
To spot the next “Greektown,” you must become an urban analyst, tracking the subtle signs of emerging cultural infrastructure. These indicators are far more predictive than a new condo development. They signal the formation of a resilient community with a built-in economic base, poised for organic growth that is less susceptible to market-wide downturns.
Your Action Plan: Emerging Enclave Scorecard
- Track School Rankings: Monitor Fraser Institute school ranking improvements in specific neighborhoods year-over-year as a sign of growing family settlement.
- Monitor Business Registrations: Scrutinize new business registrations with ethnic naming conventions through City of Toronto databases to spot emerging commercial hubs.
- Analyze Transit Ridership: Examine TTC ridership data for routes connecting industrial or employment hubs to affordable residential areas, indicating new commuter patterns.
- Map Community Hubs: Chart applications for new places of worship and cultural center permits by neighborhood to identify the physical anchors of new communities.
- Follow BIA Formation: Watch for the formation of new Business Improvement Areas (BIAs) with a specific cultural focus, a formal sign of commercial organization.
Little Italy or Little Portugal: Which Offers Better Walkability for Young Families?
When investors target neighborhoods with strong cultural identities, it’s crucial to move beyond branding and analyze the practical amenities that drive long-term residential demand. For a young family, “walkability” is a prime example—it’s not just about sidewalks, but about easy access to parks, groceries, and community spaces. A direct comparison between Toronto’s Little Italy and Little Portugal reveals how two adjacent, culturally rich neighborhoods can offer distinct value propositions based on their physical layout and infrastructure.
Little Italy, centered on College Street, is a vibrant, high-density corridor. It boasts an extremely high concentration of restaurants and cafes, rivaling the density of other famous districts. For instance, it’s a well-known fact that Greektown on the Danforth boasts one of the highest restaurant concentrations per kilometre in the world, and Little Italy offers a similar bustling energy. This makes it highly attractive for couples and individuals who prioritize a dynamic, entertainment-focused lifestyle. However, its access to significant green space is more limited, which can be a drawback for families with young children.
In contrast, Little Portugal, concentrated along Dundas Street West, offers a different flavour of walkability. While still rich with authentic bakeries and shops, its housing stock is dominated more by residential Victorian homes, and its primary competitive advantage is its proximity to Trinity-Bellwoods Park. This large, well-equipped park is a massive draw for families, providing a backyard for a dense urban area. This fundamental difference in urban design—a bustling commercial strip versus a residential area anchored by a major park—creates distinct appeal for different buyer demographics.
The following table breaks down these key differences, providing a clear framework for assessing which neighborhood better aligns with the “young family” demographic.
| Factor | Little Italy (College St) | Little Portugal (Dundas West) |
|---|---|---|
| Main Corridor | College St (Bathurst-Ossington) | Dundas West (Trinity-Bellwoods area) |
| Transit Access | Streetcar & bus routes | Multiple transit options |
| Housing Types | Mix of condos & older homes | Victorian homes & apartments |
| Park Access | Limited green space | Trinity-Bellwoods Park adjacent |
| Restaurant Density | Very high – Italian focus | Moderate – Portuguese bakeries |
| Pedestrian-Friendly | Yes – walkable corridor | Yes – residential feel |
The Respectful Visitor’s Error That Offends Locals in Traditional Neighborhoods
Investing in culturally specific neighborhoods carries a responsibility that goes beyond financial analysis. The most significant error an investor or new resident can make is viewing a community as a monolithic entity or a thematic backdrop for their investment. This perspective, however unintentional, ignores the internal diversity, history, and social dynamics of the very community that creates the neighborhood’s value. Treating a living, breathing community as a static “brand” is not only disrespectful but can also lead to friction that undermines the area’s social fabric and, ultimately, your investment’s long-term stability.
History provides a stark warning of what can happen when ethnic communities are misunderstood or treated as a single, undifferentiated group. These historical tensions, though from a different era, underscore a timeless principle: a neighborhood’s identity is complex and layered, and to engage with it successfully, one must approach it with curiosity and respect for its nuances. Ignoring this can lead to being perceived as an extractor of value rather than a contributor to the community.
Historical Context: The 1918 Toronto Anti-Greek Riot
Before Greektown was on the Danforth, Toronto’s Greek population of around 3,000 was concentrated downtown. This area became the flashpoint of the 1918 anti-Greek riot, a violent event fueled by wartime prejudice and social misunderstanding. This historical event demonstrates how treating an entire ethnic community as a single, uniform bloc has, in Toronto’s own history, led to profound social conflict. It serves as a powerful reminder of the importance of understanding the specific history and internal diversity of any neighborhood you invest in.
For the modern investor, this means doing your homework. Before proposing changes or even starting a renovation, it’s crucial to engage with the local Business Improvement Area (BIA), attend community events, and speak with residents from multiple generations. Acknowledge that a “Chinese” neighborhood may have residents from mainland China, Hong Kong, and Taiwan, with different dialects, traditions, and viewpoints. A “South Asian” enclave is a rich tapestry of Indian, Pakistani, Bangladeshi, and Sri Lankan cultures, each with its own identity. Recognizing and respecting this internal diversity is the foundation of a sustainable and socially responsible investment strategy.
How to Assess a Neighborhood’s Vitality by Counting Independent Ethnic Grocers?
In a city with over 140+ official neighborhoods and countless established ethnic enclaves, an investor needs a “boots-on-the-ground” method to quickly gauge a community’s economic health. One of the most effective, yet overlooked, vitality metrics is the density and diversity of independent ethnic grocers. These establishments are more than just places to buy food; they are foundational pillars of a neighborhood’s micro-economic ecosystem. Their presence signals a stable, local customer base with specific cultural needs, a strong indicator of a community that is self-sustaining.
A single large chain supermarket can serve any demographic, but a cluster of grocers—one specializing in Halal meats, another in Korean kimchi, and a third in Caribbean spices—tells a much richer story. It indicates that the population is large and stable enough to support multiple specialized businesses. This diversity within the commercial landscape is a direct reflection of the diversity and integration within the residential population. It proves the neighborhood is not just a settlement, but a thriving, integrated community. This diversity of products, from fresh produce to imported goods, is a tangible measure of the neighborhood’s vitality.

An analyst can take this further. Are these businesses first-generation-owned, or are second-generation entrepreneurs opening modern, fusion-oriented stores? The latter signals demographic momentum and market evolution, a sign that the community is not just surviving but adapting and growing. It shows that younger generations are choosing to stay and reinvest in the neighborhood, ensuring its long-term viability. Tracking the variety of product origins can also reveal the depth of the local economy; a reliance on local suppliers in addition to international importers suggests a more complex and resilient economic network.
By mapping the number and type of ethnic grocers, specialty shops, and related service businesses within a one-kilometer radius, an investor can construct a powerful, real-time index of a neighborhood’s economic and cultural health. This method provides a clear, data-driven snapshot that is often more predictive of future stability than traditional real estate metrics alone.
Good Schools vs Transit Access: Which Drives Property Value Higher in the Suburbs?
The classic Toronto real estate debate often pits two titans of value against each other: a top-ranked school district versus proximity to a major transit hub like a GO Station or subway stop. For investors looking at suburban markets in the GTA, understanding which of these factors provides a more significant and resilient lift to property values is critical. While both are powerful drivers, they appeal to different demographics and offer different kinds of stability. The data suggests that while transit creates value, the premium for elite schools is often higher and more resistant to market downturns.
Access to transit is a logistical necessity for a large segment of the workforce, particularly young professionals and commuters who value time and convenience. Properties within a short walk of a GO or TTC station consistently command a premium. However, this value is tied to the employment market. In a remote-work-heavy economy or a recession, its premium can soften. In contrast, the demand for homes in top school districts is driven by a powerful, non-negotiable life stage: raising a family. Parents will consistently pay a significant premium and compete fiercely for homes that grant their children access to a high-performing school. This demand is less correlated with economic cycles and more with demographic waves.
Case Study: The Rapid Value Impact of School Improvement
The power of school performance is not static. Toronto Ouest, a French public school, demonstrated one of the fastest academic improvements recorded by the Fraser Institute, with its rating soaring from 4.9 out of 10 in 2016 to a remarkable 8.5, despite having 13.7% of its students with special needs. As documented in a Fraser Institute analysis, such rapid improvement can dramatically and quickly increase a neighborhood’s desirability and property values, proving that school performance is a dynamic and powerful leading indicator for investors.
The decision for an investor, therefore, depends on their target demographic and risk tolerance. A condo near a subway station offers a solid return based on commuter demand, while a house in a top school zone offers a more resilient, family-driven premium. The most stable investments often lie where these two factors overlap, but when forced to choose, the data suggests the “school effect” is a uniquely powerful and recession-resistant force in the Toronto suburban market.
| Factor | Top-Ranked Schools Areas | Transit-Oriented Areas |
|---|---|---|
| Primary Value Driver | Fraser Institute rankings (746 schools ranked) | GO Station & subway proximity |
| Typical Premium | 15-25% for top 10% schools | 10-20% within 1km of stations |
| Buyer Demographics | Families with school-age children | Young professionals & commuters |
| Long-term Appreciation | Stable, consistent growth | Spikes with transit expansion |
| Market Resilience | Highly recession-resistant | Moderate recession resistance |
Why the Best Dim Sum Is Found in Markham and Not Downtown Chinatown?
The location of a city’s “best” food is a powerful leading indicator of demographic and economic shifts. For decades, Toronto’s downtown Chinatown was the undisputed epicenter for authentic Chinese cuisine. However, in recent years, the locus of high-quality, destination-worthy dim sum has decisively migrated north to suburban cities like Markham and Richmond Hill. Understanding this shift is crucial for an investor, as it’s a tangible manifestation of demographic momentum and the evolution of cultural infrastructure.
This migration is not a matter of taste, but of economics and space. Toronto’s original downtown Chinatown has faced decades of gentrification and rising commercial rents. This economic pressure makes it difficult to operate the large, high-capacity restaurants required for traditional dim sum service, which relies on high volume. As first-generation business owners retire, their smaller downtown locations are often replaced by businesses with higher-margin models that can survive the punishing rents.
Case Study: The Suburban Migration of Toronto’s Chinese Cultural-Economic Center
Toronto’s downtown Chinatown, established on Spadina in the 1950s after the original was expropriated, began a process of redefinition in the 1990s. As the Chinese-Canadian community grew in affluence, many families and businesses moved to suburban areas like Markham. These suburbs offered lower commercial rents and the ability to build larger, more modern restaurants with ample parking. This shift allowed for higher-investment establishments to flourish, effectively moving the region’s center of ‘cultural capital’ for high-end Chinese cuisine away from its historical downtown core.
For an investor, tracking the migration of “cultural capital” is a predictive tool. When high-investment, community-anchor businesses (like a 300-seat dim sum palace) choose to locate in a suburb, it signals that a critical mass of the target demographic already lives there and, more importantly, that the economic conditions are favorable for large-scale enterprise. These suburban ethnic hubs become destinations in their own right, creating a resilient local economy that is not dependent on downtown foot traffic. Following the chefs, the large-format restaurants, and the second-generation entrepreneurs is a real-world strategy for identifying where economic power and, consequently, stable property values are consolidating.
Key Takeaways
- A neighborhood’s economic resilience is tied to its “cultural infrastructure”—the network of businesses, festivals, and community hubs that create a self-sustaining micro-economy.
- Leading indicators of growth include the density of ethnic businesses, improvements in local school rankings, and the migration of “cultural capital” like destination restaurants to suburban areas.
- A successful investment strategy in Toronto requires a nuanced, “boots-on-the-ground” analysis that respects a community’s history and internal diversity.
Choosing a Strategic Neighborhood: How to Spot Gentrification Before Prices Spike?
Synthesizing all these factors, the ultimate goal for a forward-thinking investor is to develop a system for identifying the precursors to gentrification and cultural evolution. The key is to spot these signals before they are reflected in asking prices. This means moving beyond lagging indicators (like rising property values) and focusing on the leading indicators of demographic and commercial change. In Toronto’s hyper-diverse landscape, this often means tracking two parallel forms of gentrification: the traditional model, often led by artists and young professionals, and a powerful, internally-driven model led by second-generation immigrants.
Traditional gentrification has its own well-known markers, with the “third-wave coffee shop” being a classic—and still effective—clue. The arrival of artisanal cafes signals that a new demographic with disposable income is moving in. However, in many Toronto neighborhoods, a more relevant indicator might be the arrival of an artisanal bubble tea shop. This signals a similar trend but is driven by a different demographic: affluent, second-generation Asian-Canadians who are shaping the commercial landscape to their own tastes. Recognizing these culturally specific signals is essential.
The final layer of analysis is financial, but with a forward-looking twist. An investor should monitor rental market data not for what it is, but for what it’s becoming. When a neighborhood’s two-year rent growth begins to significantly outpace its five-year average, it’s a sign of accelerating demand. Similarly, when capitalization rates approach the 5% threshold, the area is becoming attractive for cash-flow-positive investment, which will inevitably draw in more buyers and push prices higher. This entire strategy is set against the backdrop of Toronto’s massive demographic shift, with the metropolitan area reaching a 57.0% visible minority in 2021, up from 13.6% in 1981. This unstoppable demographic momentum is the fundamental engine driving the resilience and evolution of the city’s neighborhoods.
Ultimately, a recession-proof real estate strategy in Toronto is one that sees the city for what it is: a complex, living mosaic of cultures. By learning to read the language of its cultural infrastructure—from festival demand to the offerings in a local grocery store—you can build a portfolio based on the fundamental, long-term strength of its communities. To put these principles into practice, the next logical step is to begin a detailed, street-level analysis of a target neighborhood using this demographic-driven framework.